Arrrgghhh! If only a retailer could know what the customer really wants and to be able to prepare accordingly!
While there is no crystal ball to guide you (as of now), there is technology available that can help you with insights and give you some direction on what’s coming up in the next few months. Interested?
If so, then step confidently into the world of data analytics. It is much simpler than it sounds; especially if you learn how to understand all the information (data) that your online business collects for you.
Once you do, you will have important understandings about your customers’ behaviour, and also a reliable grasp of market trends. These are key to finding real answers regarding what lies ahead for your business and to develop a meaningful plan for taking it forward.
Start by gathering insights that matter
What are your most popular products? How did your buyers reach your store? Were the customers who completed a transaction first time buyers at your store or were they your faithful regulars? What is the profile of those buyers? How long did they stay on each page? How many items were they buying on an average? Did the festive discount have any impact on your revenue? How popular was the combo that you created? What was the average transaction value in your store? How often did you find an abandoned shopping cart?
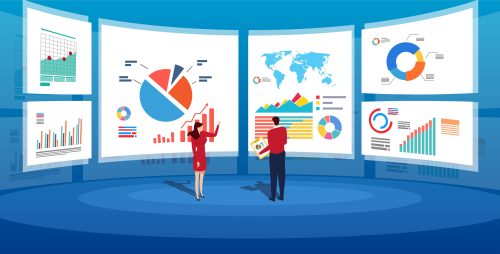
If you have set up your store on the Shopmatic platform, then you have access to a built in analytics capability that provides many valuable insights to help you grow your business. Such data can be viewed on a single dashboard and allows you to monitor the volume of your sales transactions on a daily, weekly or monthly basis. It also allows you to track your business growth.
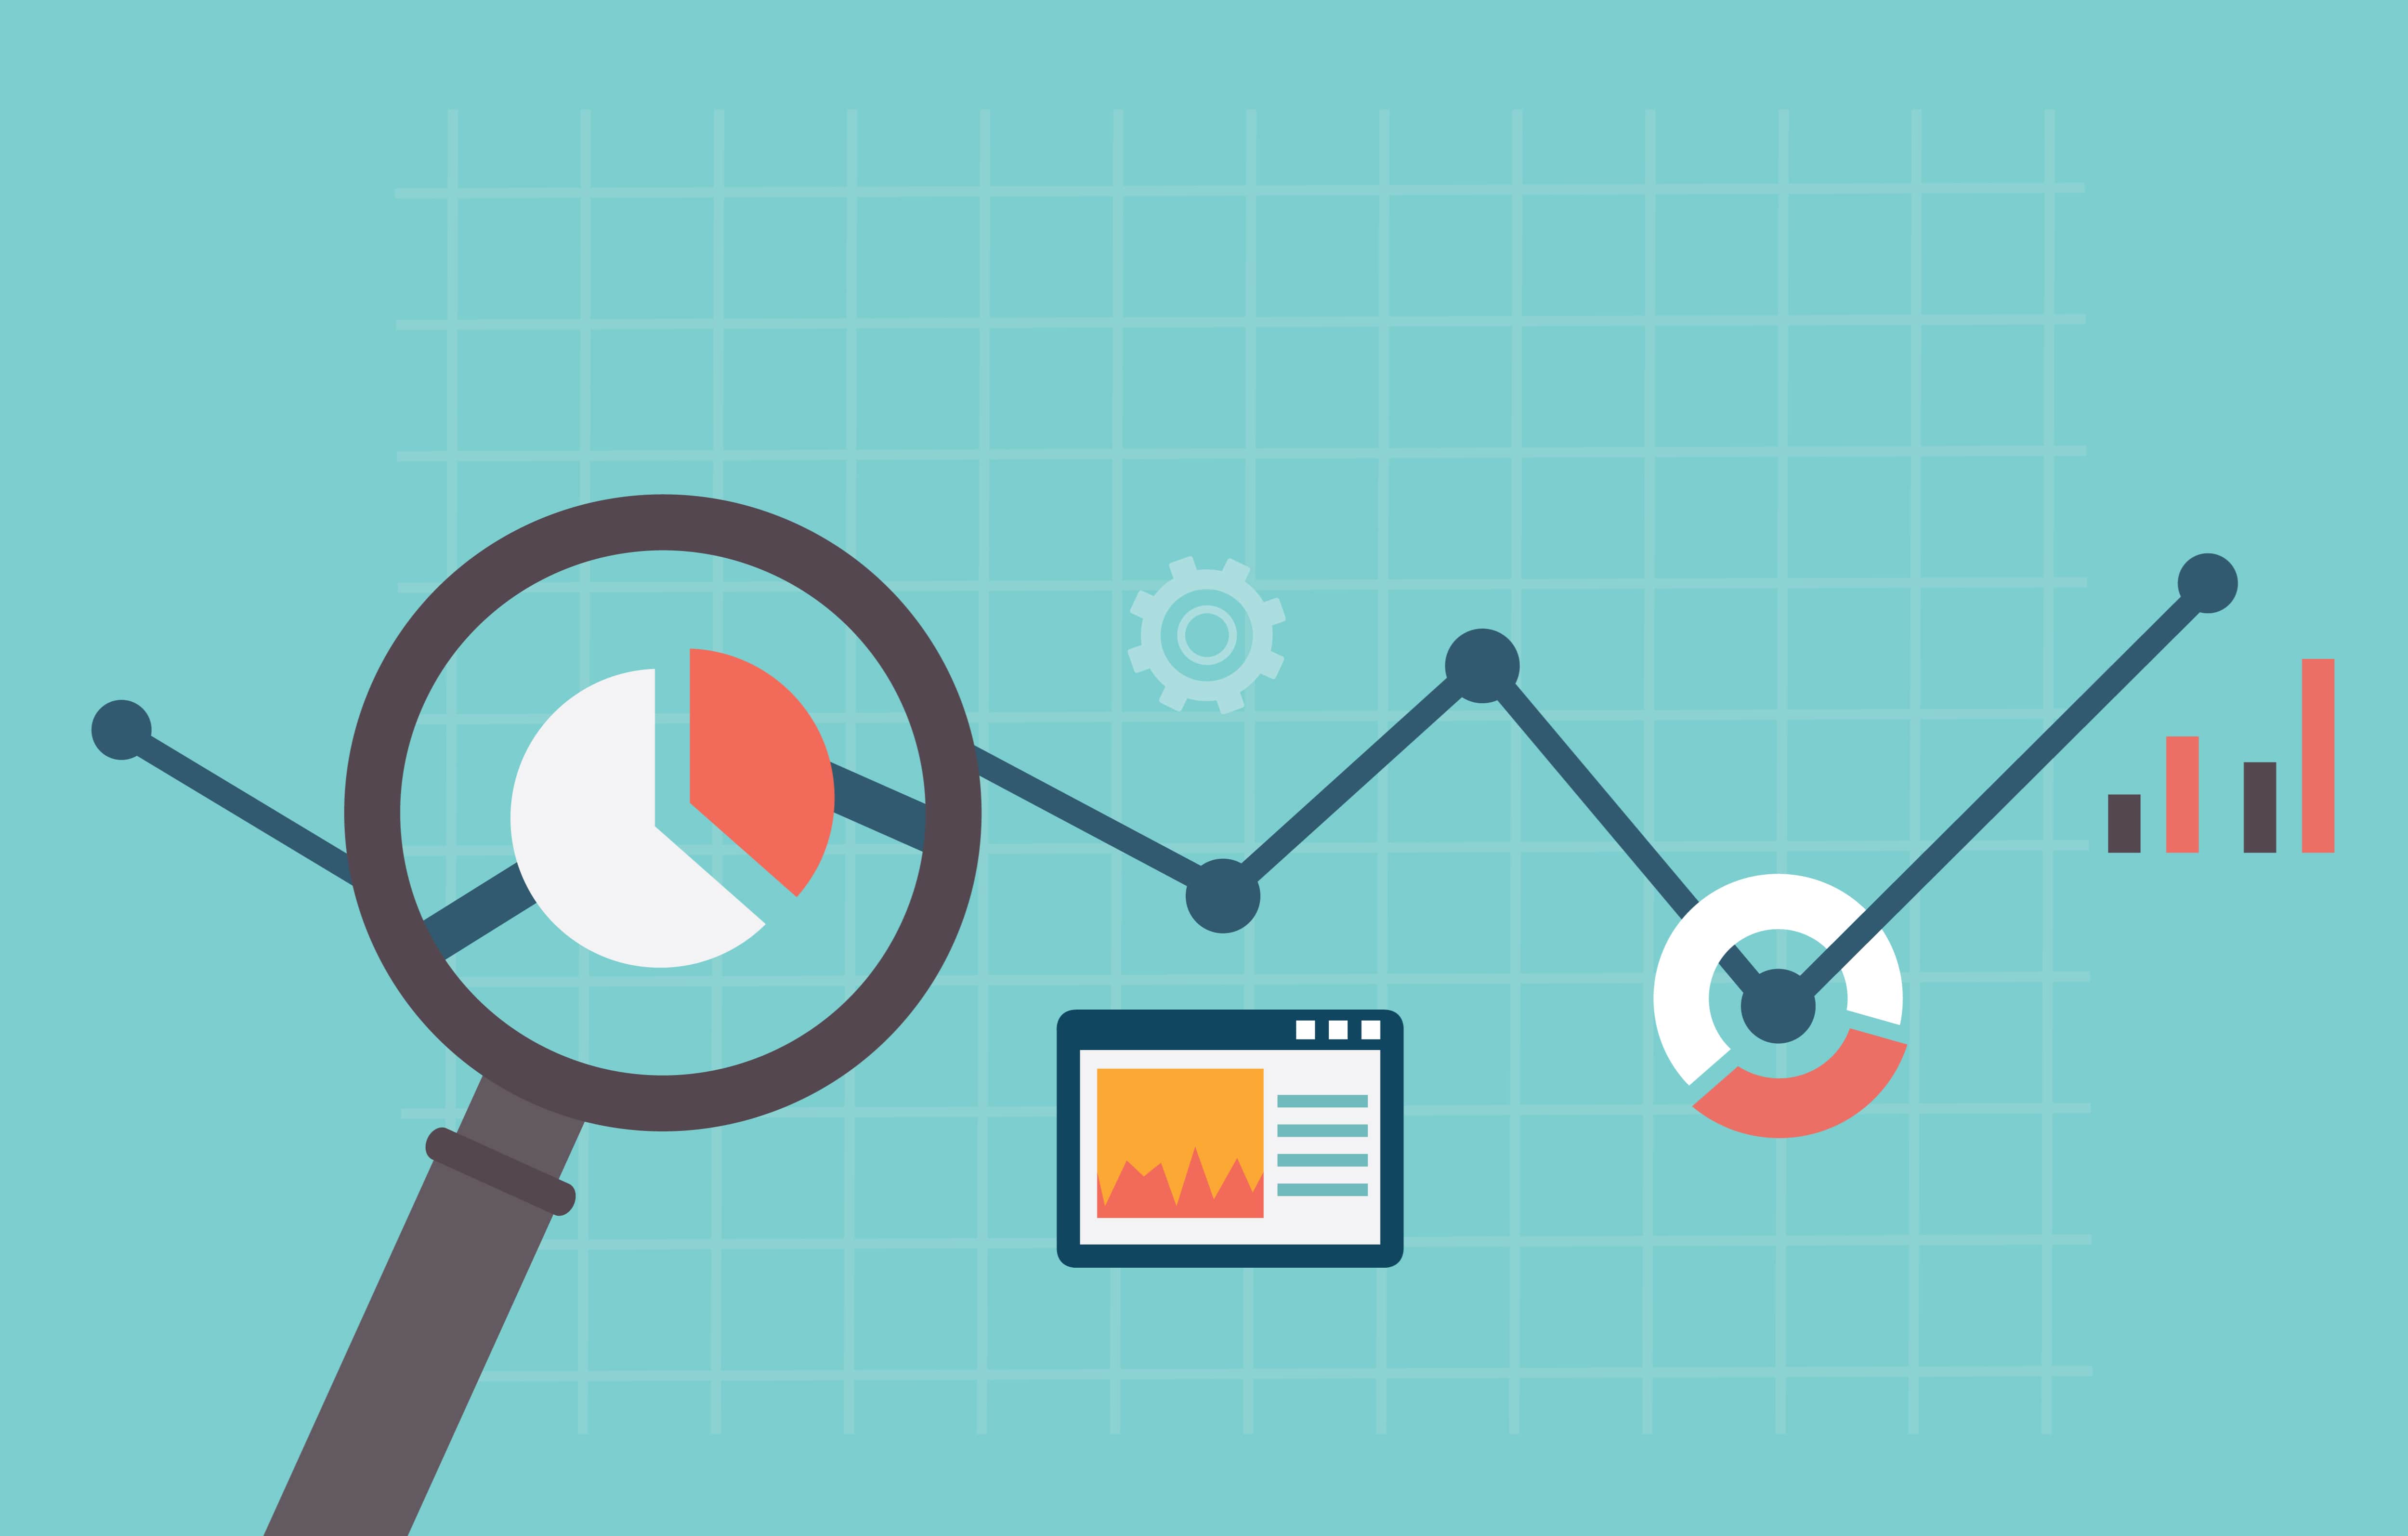
There are charts and visual formats that give you a better and quick view of the data on your customised dashboard so that you can identify shopping trends straightaway.
Shopmatic’s business intelligence tools can also help identify customer or product segments that are generating the most revenue for your business.
These insights can be used by you to tweak your inventory and your pricing strategy to better prepare for periodic sales spikes and boost sales.
The data insights can also be used to build customer profiles, enabling you to identify high yield customers and frequent buyers. You can target these customers with emails that are specifically worded to resonate with them, perhaps including targeted promotions to keep them engaged.
Sending out specifically targeted emails makes it more likely for your emails to be opened since it feels more personal to the customer
Analytics from your dashboard can also help you identify reasons for abandoned carts. Once more, this comes in handy for tweaking operations or systems in your store so that such incidents are minimised, as well as reaching out to customers to either urge them to complete the sale, or to ask them what prevented them from completing it.
As you can see, looking keenly at the data your store gathers will give you the ability to truly understand your customers and your business so you can make the right decisions to its advantage.
Use the versatile Excel programme for clarity
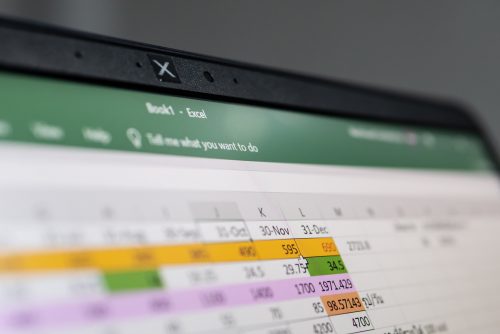
Customer and revenue data available at the Shopmatic dashboard can be easily downloaded into an Excel file. This programme is widely used for day to day functioning by most businesses and opens up many more possibilities of deeper analysis and understanding of your needs. Segmentation of the data helps add context and often makes it more actionable.
If you are not very familiar with it, start with a simple example. Say you are simply trying to consolidate revenues from the entire silver jewellery range or a subset (say only silver rings) over the duration of the month. The Excel SUM function, which adds individual values, cell references or ranges or even a mix of all three and can be useful for you.
COUNTIF is one of the functions to count the number of cells that meet a criterion eg. count the number of times the buyers are searching for a complementary product after putting the first item into the shopping cart. This can help you decide if it is worthwhile on bundling matching products (as combos), thereby increasing the average transaction value.
The AVERAGE function gives the arithmetic mean of the arguments. This is useful for understanding data like average number of visits to the store or even average revenue generated daily.
Once you get started with Excel, you will realise it is a program immensely applicable in your everyday data analysis.
Use charts and graphs for a straightforward understanding
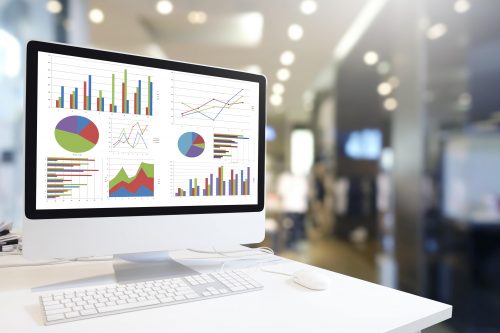
Visual representations are a powerful way to understand complex data simply and quickly. This builds confidence so that business decisions can be taken with clarity and authority.
The Excel data can also be converted to charts and graphs by selecting the range of data you wish to chart and press F11. Such visual representation can often show more than revealed by the underlying numbers, whether you are highlighting trends or comparing sales
These can then be customised to your needs and provide a quick and easy understanding of business and data outcomes like the Average Order Value in your store, Conversion Rate etc.
Model some data to notice trends

Data can also be used for modelling by conducting what is known as ‘regression analysis’ to observe the correlation between events.
Basically this means we try to spot a pattern in the data, interpret it and then make predictions based on that.
Such analysis is useful for measuring the success of your marketing campaigns, analysing traffic sources to your online store, and the trend of metrics like sales and average order value over time.
For eg. Did the festive promotions/ discounts have any impact on sales? Did the introduction of the new range of semi-precious stone jewellery have any impact on the sales of the existing range of silver jewellery? Did the Facebook live events help generate more sales?
Answers to such questions can then help you plan your sales strategy going forward.
Use Google Analytics for sure
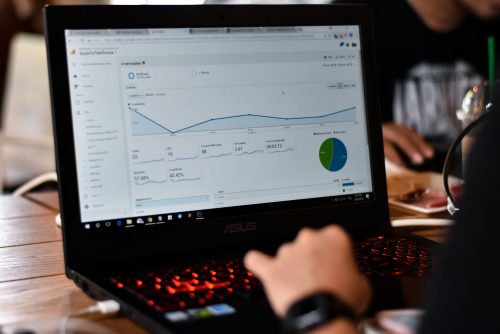
This is probably one of the most efficient, popular and insightful data analytics tools available in the market. Moreover, most of the more commonly used features come free. All you need is to have a Google account to access this for your Shopmatic store
And then, inserting and saving the Tracking Code of your Google Analytics account into your Shopmatic admin account- (manage tab – select Marketing followed by Google Analytics) allows you to access Google Analytics data.
The detailed insights generated regarding how the visitors find and use your website is remarkable! Information on where your visitors are coming from, the duration of time they spend at your store, whether they are first timers or repeat customers, the pages they visit, the bounce rate etc are just a few data points that they can provide among a lot more.
Such information can be very helpful in understanding buyer behaviour while planning your future marketing campaigns. You can use this to find new customers and increase conversions in order to maximise revenue and growth.
Analyzing buyer data can be a powerful technique to predict future outcomes. Accuracy of the data is however important. Adoption of a few of the many data analytics tools available in the market can go a long way in helping businesses like yours make correct predictions and prepare for future opportunities. Identify potential growth markets and product lines to plan a successful growth strategy for your ecommerce business!