Understanding Analytics
Your online store is up and running but how do you know exactly who your customers are, how the website is performing and how you can continually improve and organically grow your online store? There is a huge amount of data on offer for traffic analytics but it is easy to become overwhelmed – here a few tips on understanding the reports and using them for website optimization to make the most of your business.

Google analytics is a powerful tool offered by Google for website testing that will track and report your website traffic. With Shopmatic Pro you will receive regular inclusive data insights into how your company is doing. Making use of the right reports and understanding the data they produce should be an integral part of growing your online business and it’s not as difficult as you would at first think. Read more about: How analytics can be used to drive sales.
To survive and thrive, business owners need to be able to make better decisions, faster; this is where analytics come into their own and can help you out.
You can expect to get a better handle on some key aspects like-
Understand What Marketing Activities are working and What Aren’t!
Without understanding which marketing activities are working and which are not – you are wasting time and money by trying to cover all bases as you are unable to find ways for how to check website performance! Instead of doubling up on your profitable channels your budget is being spent across profit and nonprofit segments! Use the data to focus on your profitable areas and improving the bad.
Understand Consumer Trends
Knowledge is power and understanding your reports will give you the edge to understand trends and which channels are not working or are not profitable. Understanding consumer behaviour also allows you to drop a product or make strategic decisions based on this information.

Understand a Funnel
You can view most brand building marketing practices as a ‘funnel’. The basic process is for a customer to click on your site, click on the product, goes to checkout, enters their details and buys the product. However, at each stage a certain percentage of your customers will drop out of the process. Understanding at what stage and why is key to improving your online business.

Track all that you can
Traffic to your site can be categorized into four different types search, referral, campaign and direct. Search traffic will come from a search engine such as Google. Referral traffic will come to you from another website such as via a link on another webpage. Campaign traffic is usually something that you have created or marketed and tagged. Direct traffic is an unknown source – but they have come direct to your online store – some examples of this could be a link on Skype, from a PDF document, or a bookmark.
If you can, try to tag each post so that you can split the results. For example, if two posts appear on Facebook – one is your standard advert and one is a promotion – they would both appear in analytics under referral traffic (from Facebook). However, if you have tagged one as a campaign it will show differently. Use a UTM at the end of your link to separately track your campaigns.

Understanding the Dashboard
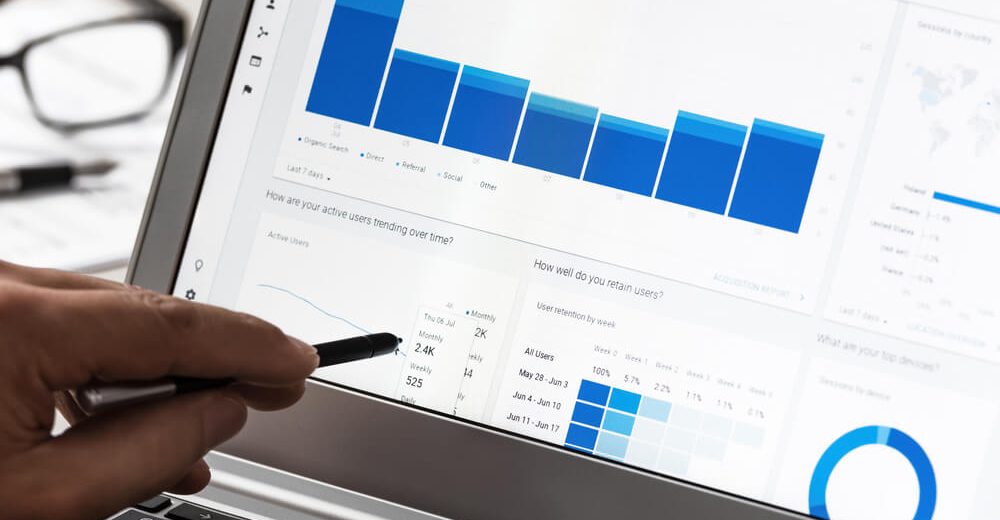
The standard dashboard will give you an overview of the number of sessions for a limited period, basically the number of visits to your website. But other reports are available and you should make the most of them.
The important first step is to customize the reports you receive to what is relevant to your business. Data available that you can use to tailor your site for your customers include:
- Geo – Especially useful if you are a local business. Keep in mind that your customers may be ‘roaming’ when they click on your store – so don’t be too concerned with a random location!! If you find that your visitors are mostly from one country try announcing this on your page – something like ‘We ship to Italy’ could entice a customer right from the start!
- Behaviour – Shows the ‘path’ that your customers take. Can be useful when deciding content or helping to discover your best and worst pages. This will also tell you how many are ‘new’ users, how many pages they click on and how long they spend browsing your site.
- Interests – your customers may have already lodged their interests with Google including art, music, food etc. Use this data to ensure that you are reaching your target audience and keep them interested.
- Technology & Mobile – This function tracks how your visitors view your online store such as mobile, pc, iPad etc. Mobiles are steadily increasing as a way to purchase online. Tailor your site to suit the most popular ways of customers viewing.
To gather and cross-reference key pieces of important data gives you a valuable insight and edge over your competitors. All companies are different in what information they would like to see – but the general reports, if read well could influence your business and your major decisions. Whether it’s deciding which products to feature in your marketing campaigns or which social media platforms are better to focus on – you should be using analytics to your advantage and to consistently improve your online business.


